



August 13,2026
Whether going out of network makes financial sense for a private dental practice comes down to one number, how much production it can afford to lose before the change costs it money.
Call it the break-even. Three things set it, and only three: what the practice collects in network, what it would collect out of network, and its variable costs.
The relationship is counterintuitive. The deeper the discount a practice is handing PPOs today, the more production it can afford to lose. The worst contracts leave the most room to move, not the least.
The advice to consider going out of network is everywhere in dentistry. The arithmetic behind it is not. What follows is that arithmetic, worked on hypothetical representative practices, plus an honest account of what it cannot tell you.
Why More Dentists Are Asking This Now
According to the American Dental Association Health Policy Institute, since January 2021 the price of dental equipment and supplies is up 23% and hourly staff wages are up 23%. General inflation ran 27%. The reimbursement rate index, averaged across all payer types, is up only 19%. And after adjusting for inflation, what patients spend on dental care grew just 1% over the last twelve months.
Costs went up and what insurance pays did not keep up, which after five years leaves you with an overhead percentage your practice was never built around. Our review of the economic outlook in dentistry covers that in more detail.
Dentists have noticed. In late 2025 the Institute asked owner dentists about their plans for 2026, and 35.0% said they intended to drop out of some insurance networks. In a separate survey the following June, 23.5% said they had done it. For a lot of owners this is a decision they reach for and then set aside, usually because nobody has put a number on the downside.
What Actually Changes When You Leave a Network
In a PPO you do the dentistry at your full fee, then write off the difference between your fee and what the plan allows. That write-off is not really an expense. No money leaves your account; it is money that never shows up.
Leave the network and the write-off goes away. You bill your full fee, the patient owes whatever the plan does not cover, and you keep more per procedure. What you lose is volume, because some patients will go find an in-network dentist.
So when owners ask should I drop PPO plans, the real question is simple: does the extra money on the patients who stay make up for the ones who go?
The Math, in Cents on the Dollar
Forget formulas and think in cents.
You produce a crown at your full fee and the PPO writes part of it off, so say you keep 75 cents of every dollar. Supplies, lab, merchant fees, and the other costs that rise and fall with how much dentistry you do take about 20 cents of that. Every dollar of production leaves you 55 cents toward rent, salaries, debt, and your own pay.
Out of network, you bill the same crown and keep, say, 95 cents. The same 20 cents of costs come out. Now every dollar of production leaves you 75 cents.
Every dollar of dentistry you do just became worth 75 cents instead of 55, roughly 36% more. So you could do less dentistry and still cover the same rent, the same payroll, and pay yourself the same. How much less? Divide 55 by 75 and you get 0.73. You need to keep 73% of your production, so you can afford to lose 27% of it.
The rule in one line: take your collection rate today and subtract your variable costs. Do the same for out of network. Divide the first number by the second. Whatever is left over from 100% is how much production you can afford to lose.
Four numbers go into it, and none of them is your overhead:
|
The number |
What it means |
Example used here |
|
Your production |
What you bill at your full fee, before any write-offs |
$1.5 million |
|
What you keep now |
Cents on the dollar left after PPO write-offs |
75 cents |
|
What you would keep out of network |
Cents on the dollar billing your full fee, after courtesy discounts, membership plan discounts, and balances that never get paid |
95 cents |
|
Your variable costs |
Supplies, lab, merchant fees, and any clinical labor that genuinely flexes, per dollar of production |
20 cents |
Your Overhead Does Not Change the Answer
Rent, debt service, front desk salaries, your software stack: none of it appears anywhere in that calculation. Those costs are the same the day before you leave a network and the day after, so they drop out of the comparison.
The instinct is that heavy overhead leaves less room to take a risk. On this question that is not true. Your overhead decides how much money is on the table, not how much production you can afford to lose. What decides that is your dental practice write-off percentage: the bigger the discount you are giving away now, the more room you have.
Three Practices, Three Answers
About these numbers. Every dollar figure below is made up. It is built to look like a plausible single-doctor practice, not to be a benchmark you should measure yourself against. Our article on peer benchmarking pitfalls explains why borrowed numbers mislead.
Picture a single-doctor practice producing $1.5 million at full fee. Hold variable costs at 20 cents and fixed costs at $525,000, and change nothing but the write-off.
|
Practice |
PPO write-off |
Cents kept per dollar |
Production it can lose and break even |
|
Heavy PPO |
35% |
65 cents |
40.0% |
|
Moderate PPO |
25% |
75 cents |
26.7% |
|
Light PPO |
15% |
85 cents |
13.3% |
The practice giving away the most has the most room to move.
What It Looks Like on the P&L
Same three practices, before and after. Out-of-network collections assume 95 cents on the dollar.
|
Heavy PPO practice |
Today, in network |
Out of network, at break-even (40.0%) |
|
Gross production |
$1,500,000 |
$900,000 |
|
Write-offs and adjustments |
$525,000 |
$45,000 |
|
Net collections |
$975,000 |
$855,000 |
|
Variable costs |
$300,000 |
$180,000 |
|
Fixed costs |
$525,000 |
$525,000 |
|
Owner earnings |
$150,000 |
$150,000 |
|
Moderate PPO practice |
Today, in network |
Out of network, at break-even (26.7%) |
|
Gross production |
$1,500,000 |
$1,100,000 |
|
Write-offs and adjustments |
$375,000 |
$55,000 |
|
Net collections |
$1,125,000 |
$1,045,000 |
|
Variable costs |
$300,000 |
$220,000 |
|
Fixed costs |
$525,000 |
$525,000 |
|
Owner earnings |
$300,000 |
$300,000 |
|
Light PPO practice |
Today, in network |
Out of network, at break-even (13.3%) |
|
Gross production |
$1,500,000 |
$1,300,000 |
|
Write-offs and adjustments |
$225,000 |
$65,000 |
|
Net collections |
$1,275,000 |
$1,235,000 |
|
Variable costs |
$300,000 |
$260,000 |
|
Fixed costs |
$525,000 |
$525,000 |
|
Owner earnings |
$450,000 |
$450,000 |
Look at how thin the light PPO case is. That practice has to hold nearly 87% of its production just to stay even, and for that owner the honest answer may be that this is not worth the disruption. If you already collect most of your fee, you have less to gain and just as much to lose.
What Happens If Fewer Patients Leave
Break-even is the floor, not the forecast. Here is the moderate practice at a range of outcomes.
|
Production you actually lose |
Net collections |
Owner earnings |
Change in your pay |
|
10% |
$1,282,500 |
$487,500 |
+$187,500 |
|
15% |
$1,211,250 |
$431,250 |
+$131,250 |
|
20% |
$1,140,000 |
$375,000 |
+$75,000 |
|
Break-even (26.7%) |
$1,045,000 |
$300,000 |
$0 |
|
35% |
$926,250 |
$206,250 |
−$93,750 |
The slope matters as much as the threshold. In this example, every percentage point of production you keep above break-even is worth about $11,250. That is the number to weigh against what it would cost you to keep those patients, whether through a membership plan, a retention push, or marketing.
How Well You Collect Changes Everything
Every model rests on estimates, and the one doing the most work here is what you actually collect out of network.
It is easy to be optimistic. Patients owe you more, some of it comes in slowly, some never comes in, and the courtesy adjustments you make to keep good patients are real money. A practice with tight financial policy that collects at the time of service might hold 95 or 96 cents. One that has always let the insurance company handle the money conversation might hold 90.
That difference is not a rounding error.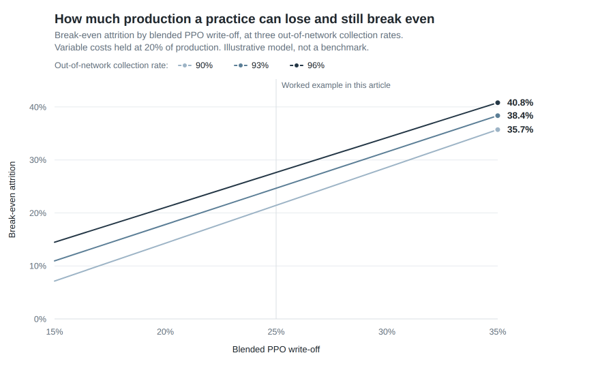
Line chart showing break-even attrition rising with the blended PPO write-off percentage, plotted at 90%, 93%, and 96% out-of-network collection rates. At a 25% write-off, break-even attrition ranges from 21.4% to 27.6% depending on the collection rate.
|
Your PPO write-off |
Break-even at 90% collection |
Break-even at 93% collection |
Break-even at 96% collection |
|
35% |
35.7% |
38.4% |
40.8% |
|
30% |
28.6% |
31.5% |
34.2% |
|
25% |
21.4% |
24.7% |
27.6% |
|
20% |
14.3% |
17.8% |
21.1% |
|
15% |
7.1% |
11.0% |
14.5% |
For the moderate practice, the answer swings from 21.4% to 27.6% based on nothing but how well the office collects. The dollars swing harder. Lose 20% of your production and you come out about $75,000 ahead if you collect 95 cents, or about $15,000 ahead if you collect 90. Same decision, same patients leaving, five times the difference.
So collection discipline is not something to clean up afterward. It decides whether this works. Tightening financial policy and time-of-service collection before you leave buys several points of breathing room.
Seven Things the Math Cannot Tell You
A formula this clean is only useful if you know where it stops working.
1. The patients who leave are usually your smallest
The math measures production you lose, not patients you lose, and the difference usually works in your favor. The patients most likely to leave tend to be the ones whose relationship with you is mostly about their benefits: lower production, insurance-driven, less consistent about coming in. If the patients who leave produce about 60% of your average, then losing 27% of your production means losing about 45% of your patients.
Sort your active patients by what they produce in a year before you decide. Your own numbers will tell you whether your best patients are the ones at risk.
2. Hygiene is where the loss lands first
Not all of your production is equally exposed. Dental plans are mostly built the same way: preventive visits covered at or near 100% and exempt from the deductible, basic work lower, major work lower still. The cleaning is the benefit patients feel most directly, so the patients who stay mainly because of their card skew toward hygiene. When they go, hygiene production is what leaves.
That matters twice over. Hygiene is where your clinical payroll sits and it does not flex the day a patient cancels, so a drop there becomes paid idle time faster than a drop in doctor production. Hygiene is also where treatment gets found: losing those patients is not just losing cleanings, it is losing the exams that would have diagnosed next year's crowns.
Split your production between hygiene and doctor before you decide, and estimate the loss separately for each. If most of your exposure sits on the hygiene side, decide now what production level triggers cutting a hygiene day.
3. Fixed costs are not fixed forever
The math holds your overhead steady. That is true for a few months and false over a year, because staffing, hours, and even space can change once you see where production settles. The risk runs both ways: move too slowly and you carry capacity you no longer need, which gives back the gain you just earned.
4. There is a cash dip, and the math hides it
The math has no calendar, so it misses this entirely. Patients leave fast, on whatever notice period your provider agreement requires, usually a matter of months. The benefit arrives slowly, because your higher fees only apply to work you do from here forward. Out-of-network balances also take more chasing than they did when a payer was handling it.
Expect a dip in the first six months even when this works, and have cash ready. Two to three months of fixed costs is a reasonable target, roughly $87,500 to $131,250 for the practice above. Our guide to cash flow management covers building that cushion.
5. New patients are the bigger long-term risk
Everyone worries about the patients they have. Where you show up for the ones you do not have yet usually matters more.
Leave a plan and you come off that plan's provider directory. Patients leaving is a one-time hit that levels off; losing the directory does not. Replacing those patients takes marketing built on what makes you different rather than which cards you take, which our article on marketing for FFS and PPO dentists works through. Budget that cost and subtract it from what you expect to gain.
6. Your team has to have a different conversation
Out of network, the money conversation moves from the insurance company to your front desk and operatory, so how treatment gets presented matters more than it did. That is a training problem, not a spreadsheet problem, and better solved before the transition than during it. Two things help: building the right team for a fee-for-service practice and raising case acceptance.
7. A membership plan changes your numbers
Plenty of practices launch an in-house membership plan alongside the transition, which gives uninsured and newly out-of-network patients a reason to stay. It also lowers what you collect. A plan offering 15% off restorative with hygiene included is a real discount, so bake it into your out-of-network collection rate, weighted for how many patients you think will sign up.
Three Numbers You Will Need
To run this yourself you need three things, and most practices cannot pull them up on demand:
- Your write-off percentage for each plan, not blended together. Plans differ a lot, and the blended number hides which contract is actually the problem.
- What each active patient produces in a year, so you can see how production is spread instead of assuming it is even.
- An honest split between fixed and variable costs. Most charts of accounts sort expenses by type rather than by whether they move with production, so you cannot read this straight off a P&L.
If those are not in your reporting today, fix that no matter what you decide about your networks. They are the same numbers behind a fee increase, an associate hire, and what your practice is worth. Start with our overview of KPIs for private dental practices, then EBITDA for dental practices.
Start With One Plan, Not All of Them
The math works on a single plan just as well as on your whole panel, and testing one beats guessing about all of them.
Take your worst-paying contract. Work out its write-off percentage and its break-even using just that plan's production, then drop it and nothing else. Watch what happens: how many of those patients stayed, what they produced, and how collections moved month to month.
Six months later you are not estimating anymore. You know, from your own patients, and you protected the rest of your panel while you found out.
One thing belongs first. All of this depends on billing a fee you can defend, so if you have not reviewed your fee schedule lately you may be giving away the benefit before you start. Our article on why now is the time to raise fees covers it.
The Bottom Line
Going out of network is not a question about courage or philosophy. It is a math question. Work out how much production you can afford to lose, compare it to what you honestly think you would lose, subtract what it costs to replace the new patients the directory was sending you, and set aside cash for the dip.
For some practices the answer is a clear yes with room to spare. If you already collect 85 cents on the dollar it may well be no, and that is a real answer rather than a failure of nerve. Running the numbers is not meant to talk you into anything. It replaces a guess with a number.
If you want help pulling your numbers together and running an out of network dental practice break-even on them, schedule a conversation with the Parkhurst team. Working through it with someone who specializes in dental practices is faster than building it yourself, and those numbers stay useful long after this decision.
Frequently Asked Questions
How many patients will I lose if I go out of network?
There is no reliable universal figure, and any source quoting one should be treated carefully. What the math gives you is a ceiling: how much production you can lose and still break even. Because the patients who leave tend to produce less than your average, the share of patients you can afford to lose is usually higher than the share of production.
Does dropping a PPO plan automatically increase profit?
No. You keep more per procedure and you produce less, so you come out ahead only if you lose less production than your break-even. In the moderate example above, losing 15% adds about $131,250 to what you take home, while losing 35% costs you about $93,750.
What write-off percentage makes going out of network worth considering?
At a 35% write-off you can lose 40% of your production. At 25% you can lose 26.7%. At 15% you can lose 13.3%. The relationship is mechanical, so the real question is whether what you honestly expect to lose sits comfortably under your number.
How long does it take to recover financially after going out of network?
Patients leave on your provider agreement's notice period, while the benefit builds over the months after as new work comes through at your full fee. Plan for a dip in the first six months rather than a smooth ramp. Planning for it matters more than predicting how deep it goes.
Do fixed costs affect my break-even number?
No. Your overhead cancels out. It decides how many dollars are at stake, not what percentage of production you can afford to lose. The answer depends only on what you collect now, what you would collect out of network, and your variable costs.
Not sure where to start? Contact us today!
References
American Dental Association Health Policy Institute. (2026). The state of the U.S. dental economy: 2nd quarter 2026 update, plus AI usage in dental practices. American Dental Association. https://www.ada.org/resources/research/health-policy-institute/dental-care-market/state-of-the-us-dental-economy
Survey note: the Institute's quarterly poll is a non-probability panel. Invitations for the second quarter 2026 wave were sent June 15, 2026 to 2,432 panel dentists, drawing 589 responses, of which 552 work in private practice. Respondents skewed toward ADA members, general practitioners, practice owners, solo and small-group settings, mid-to-late-career dentists, and urban areas. The network participation figures reflect owner dentist responses and are reported by the Institute as unpublished data.
All practice financials in this article are illustrative and were constructed for the model. They are not survey results, benchmarks, or client data.
Back to issue